How it works
One method.
Six moves.
Every RWR engagement runs the same disciplined route. Nothing improvised, nothing bespoke where it doesn't need to be, so outcomes are repeatable, and reporting is comparable across quarters.
The RWR method
Assess · Detect · Validate · Service · Verify · Report
Each step ends in an artefact the next step can build on. That's what makes it a managed service, not a sequence of one off visits.
-
01
Assess
We scope your network, review records, and set the baseline for measurable loss reduction.
-
02
Detect
Satellite imagery, priority scoring algorithms, and layered synthesis surface the highest risk segments of your network, no crew mobilisation required at this step.
-
03
Validate
Certified technicians revisit every candidate on the ground, confirm the leak, and score it before any dispatch.
-
04
Service
We coordinate the repair, dispatch, permits, contractors, and reinstatement, end to end.
-
05
Verify
After repair pressure and flow checks confirm the recovery is real and holding.
-
06
Report
Reporting ready for the board on losses found, recovered, and outstanding, on your cadence.
Results, in shape
Baseline → recovered.
Illustrative district view. The figures on this page are illustrative, sized to demonstrate the shape of a managed RWR program, not to disclose customer data. We publish real outcomes only with client consent.
31%
Illustrative NRW reduction
214
Leaks resolved (illustrative)
2.4×
Faster mean time to repair
100%
Recovery verified sites
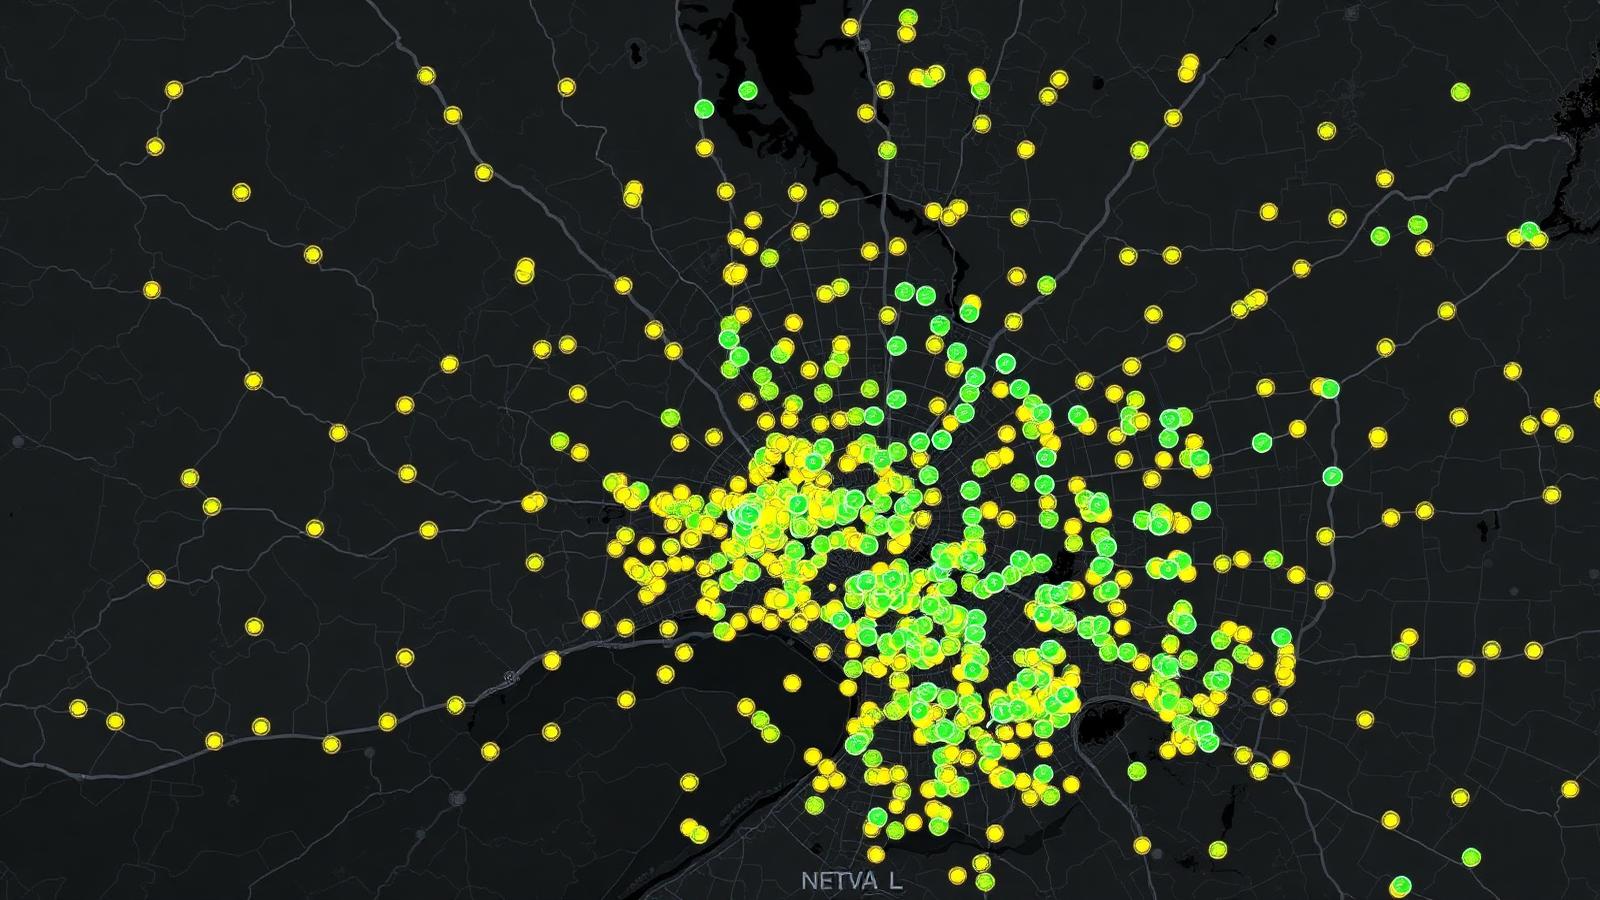
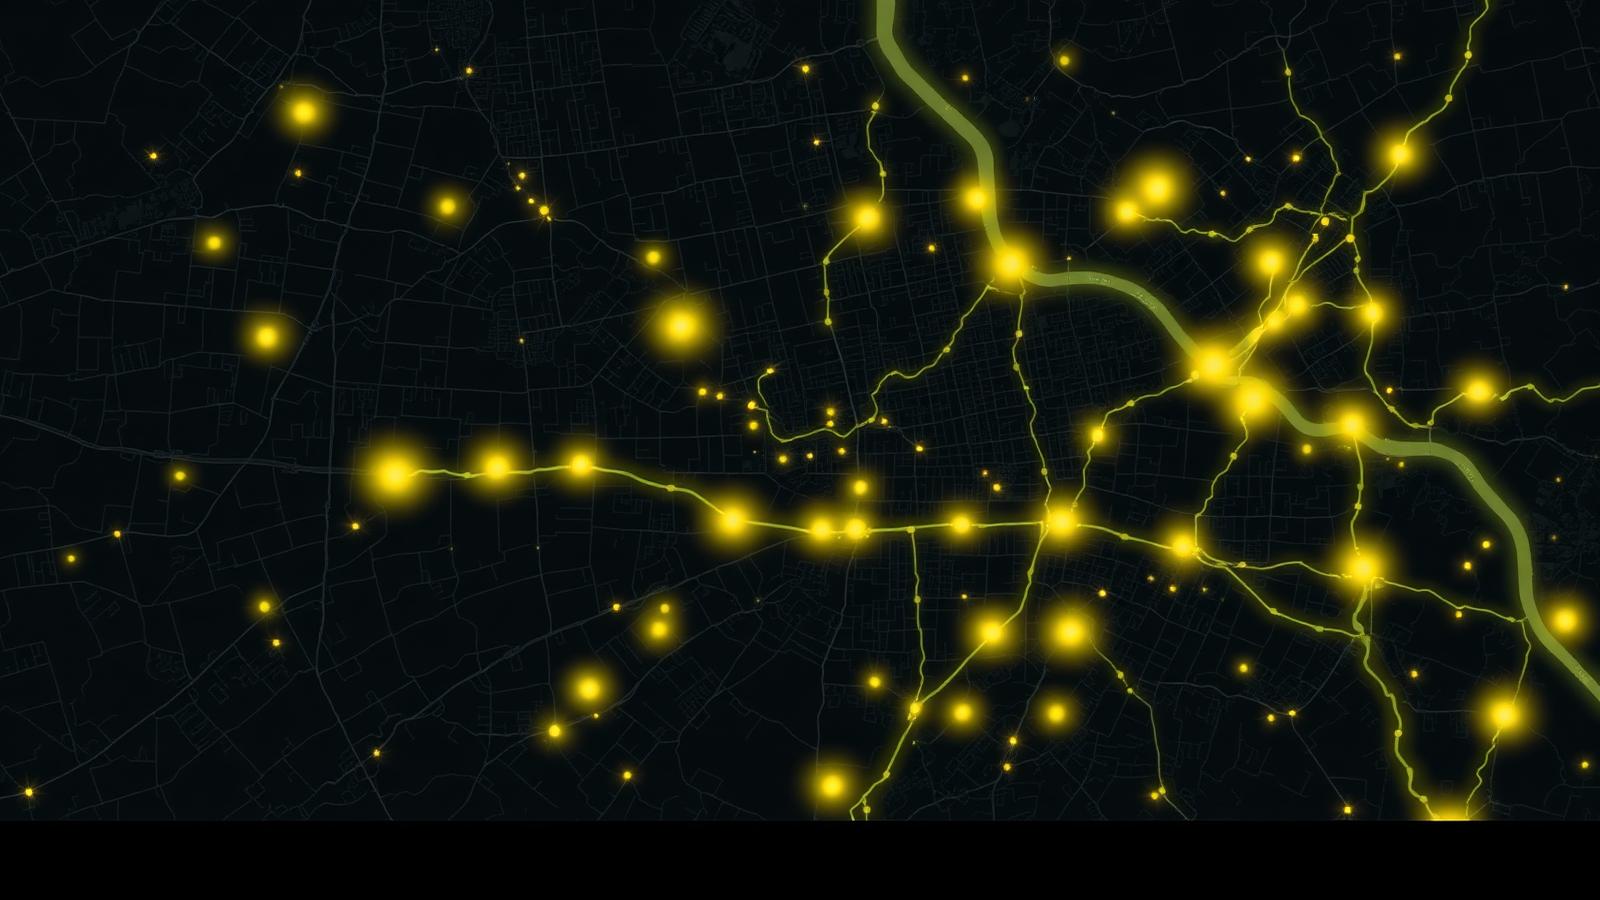 Baseline
Recovered
Baseline
Recovered
Illustrative figures for orientation. Not case study data.
Illustrative case
Metro Water Utility, a walkthrough.
A composite scenario for a midmarket urban utility. No real names, no real numbers, just the shape of a managed program from baseline to renewal.
- BaselineA full network sweep sets the loss baseline and ranks every anomaly by severity.
- ValidateField crews revisit each candidate, eliminate false positives before field deployment, and score what remains.
- ServiceRepairs run on a managed schedule with permits, contractors and reinstatement handled.
- RenewVerified recovery is reported, the backlog is reranked, and the cadence rolls forward.
Then what?
Rinse. Repeat. Compound.
A managed program runs on a rolling cadence, the same six moves, repeated on the parts of the network that need them most. Losses stop being a surprise and start being a trend line.